Someone posted much of that to Reddit in the Attia subreddit. I made some additions and adjustments with help from Claude.ai and some googling around.
If you have any suggestions on what to adjust l, add or change please let me know.
Someone posted much of that to Reddit in the Attia subreddit. I made some additions and adjustments with help from Claude.ai and some googling around.
If you have any suggestions on what to adjust l, add or change please let me know.
Mine just tested at 5.7 and while I’d like it lower, it’s not a huge concern to me. Mainly because my insulin is low (4.7 w/ HOMA-IR of 1.1), and it’s my hunch that insulin resistance is a bigger (and partially dissociable) issue than high blood sugar.
While probably many people are aware that insulin resistance/dysfunctional insulin receptor signaling is caused by defects in the PI3K signaling cascade, most probably don’t realize that insulin receptor can signal ‘non-canonically’ through the ERK MAPK pathway. In fact, in humans, this insulin receptor-ERK pathway doesn’t become desensitized even in the context of insulin resistance.
It’s becoming the consensus that the ERK MAPK pathway is a fundamental pro-aging cellular module, and it is upregulated across tissues in an age-dependent fashion. In fact, in mice, various lifespan extending agents (e.g anti-IL-11, rapamycin, acarbose, 17alpha-E2, and canagliflozin) can prevent this age-dependent increase in ERK activity. And we know that trametinib, which inhibits the ERK pathway, also may act as a geroprotector.
Another emerging view is that the AP-1 family of bZIP transcription factors is a fundamental driver of epigenetic aging. The ERK pathway is a well-known positive regulator of AP-1 family activity, stabilizing its substrate c-JUN and inducing c-FOS, for example.
My thinking is that insulin resistance would lead to systemically elevated insulin receptor-ERK signaling, which in turn might accelerate epigenetic cellular aging across tissues via AP1-dependent chromatin remodeling.
From what I’ve seen, the only things here I would correct
Ferritin 50-100
DHEA-S (in men) 300-500
IGF1 150-250
TSH 0.5-2.5
The rest looks spot on to me
With some help from Claude.ai, here are updated ranges:
Ferritin:
Men: 30-200 ng/mL
Premenopausal women: 30-100 ng/mL
Postmenopausal women: 30-200 ng/mL
He prefers lower half of ranges.
DHEA-s:
Age and gender-dependent. Generally:
Men: 350-500 µg/dL
Women: 200-380 µg/dL
The Drive podcast #59 with Dr. Gabrielle Lyon
IGF-1:
Age-dependent. For adults:
100-200 ng/mL
The Drive podcast #82 with Dr. Robert Lustig
TSH:
0.5-2.5 mIU/L
The Drive podcast #07 with Dr. Thomas Dayspring
Also edited;
SHBG:
20-50 nmol/L for men
50-100 nmol/L for women
He emphasizes that SHBG levels at the lower end of this range are generally preferable, as higher SHBG can bind more testosterone, potentially reducing free testosterone availability.
Source: This information comes from The Drive podcast episode #112 with Dr. Brad Stanfield,
ALT:
< 30 U/L for men
< 20 U/L for women
AST:
< 30 U/L for both men and women
Source: The Drive podcast #82 with Dr. Robert Lustig and #122 with Dr. Nir Barzilai.
Nice! I was pretty close
Full list with these and some other modifications:
| Biomarker Test | Optimal Range for Males | |
|---|---|---|
| Lipid & cardio risk | ||
| LDL-C (mg/dL) | under <70 (<100 recommended) The Drive #3 Ron Krauss | |
| HDL-C (mg/dL) | >40 men / >50 woman; or >60 The Drive #3 Ron Krauss | |
| Triglycerides (mg/dL) | <100 optimal, <150 recommended The Drive #3 Ron Krauss | |
| Non-HDL-C (mg/dL) | <80 optimal, <130 recommended The Drive #3 Ron Krauss | |
| VLDL-C (mg/dL) | <15 optimal, <30 acceptable | |
| TG/HDL-C | <2.0 The Drive #2 Robert Lustig | |
| Total Cholesterol (mg/dL) | <200 The Drive #3 Ron Krauss | |
| Triglycerides-to-HDL ratio | < 1 optimal, <2 recommended The Drive #82 Robert Lustig | |
| Omega 3 Index (OmegaQuant) | >8% good, >10% better, >12% mentioned The Drive #47 Bill Harris | |
| Lp(a) (mg/dL) | <30 optimal, <50 recommended The Drive #7 Thomas Dayspring | |
| ApoB (mg/dL) | 20-30 mg/dl / <65 optimal, <80 recommended The Drive #7 Thomas Dayspring | |
| ApoE (mg/dL) | Not E4 | |
| APoA1 | >150 | |
| LDL-P | <1000 lower risk The Drive #7 Thomas Dayspring | |
| Inflammation & Oxidative Stress | ||
| Homocysteine (µmol/L) guy I | <9 / <10 The Drive #82 Robert Lustig | |
| hsCRP (mg/dL) | <1 The Drive #82 Robert Lustig | |
| Uric acid (mg/dL) | Men: <5 optimal, >7.0 okay. Women: <6 optimal. The Drive #82 Robert Lustig | |
| ADMA | <100 | |
| SDMA | 73-135 | |
| Lp-PLA2 | Low risk: <200 ng/mL | |
| NT-proBNP | <125pg/mL (<75 y/o), <450pg/mL (>75 y/o) | |
| Fibrinogen Activity | 200-400 mg/dL general guideline | |
| Glucose Metabolism & Insulin Sensitivity | ||
| Fasting Insulin (µIUu/mL) | <6 optimal, <8 recommended The Drive #82 Robert Lustig | |
| Fasting Glucose (mg/dL) | <90 optimal, <100 recommended The Drive #82 Robert Lustig | |
| HOMA-IR | <1 optimal, <1.5 recommended The Drive #82 Robert Lustig | |
| Glucose | <140 @ 30’; <120 @ 60’; <100 @ 90’ | |
| Insulin | <40 @ 30’; <30 @ 60’; <20 @ 90’ | |
| A1C (aka HbA1C) (%) | Outlive says <5.1%; preferably <4.9 (lower is better); Attia chatbot says 4-5.5% of total Hgb; LabCorp <5.7% | |
| Average 24 hour glucose | 3.9-5.5 mmol/L OR 5 mg/dl with a standard deviation of 15 | |
| Two-Hour Insulin | < 30 | |
| Sterols | ||
| Campesterol (mg/L) | 2.20 - 4.44 | |
| Sitosterol (mg/L) | 1.55 - 3.00 | |
| Lathosterol (mg/L) | 0.85 - 2.45 | |
| Desmosterol (mg/L) | 0.85 - 1.45 | |
| Thyroid | ||
| TSH (µIU/mL) | 0.27 - 4.2 0.93 - 1.70 TSH: 0.5-2.5 mIU/L Source: The Drive podcast #07 with Dr. Thomas Dayspring | |
| fT4 (ng/dL) | 0.93 - 1.70 / 1 - 1.50 | |
| fT3 (pg/mL) | 2.8 - 4.0 / 2.3 - 4.2 general guideline | |
| rT3 (Reverse T3) (ng/dL) | <12 | |
| ATA (ng/mL) | <1 | |
| ATPA (IU/mL) | <34 | |
| Sex Hormones & Growth Factor | ||
| Estradiol (pg/mL) | 25 - 45 / 20-30 pg/mL (men); Premenopausal women: Varies with menstrual cycle, Postmenopausal women: < 10 pg/mL. The Drive podcast #112 with Brad Stanfield | |
| FSH (mIU/mL) | 1.5 - 12.4 | |
| LH (mIU/mL) | 1.7 - 8.6 | |
| SHBG (nmol/L) | 20-50, lower end of range preferred The Drive podcast #112 with Brad Stanfield | |
| Testosterone (ng/dL) | 600-900 The Drive podcast #112 with Brad Stanfield | |
| Free testosterone (ng/dL) | 10-15mg/dl = 100-150pg/ml optimal; The Drive podcast #112 with Brad Stanfield | |
| IGF-1 Insulin like growth factor | 84-270 IGF-1: Age-dependent. For adults: 100-200 ng/mL Source: The Drive podcast #82 with Dr. Robert Lustig | |
| PSA (ng/mL) | <4 ng/ml = <0.4 pg/dl | |
| Progesterone | 0.2 to 1.4 ng/mL (normal range | |
| Prolactin (ng/mL) | Men <15, women <25 | |
| Cortisol (ug/dL) | 10-20 in morning on waking | |
| DHEA-S | Male 40-49: 95-530 - Age and gender-dependent. Generally: Men: 350-500 µg/dL Women: 200-380 µg/dL Source: The Drive podcast #59 with Dr. Gabrielle Lyon | |
| Liver | ||
| ALT (U/L) | <30 men, <20 women The Drive podcast #82 with Robert Lustig | |
| AST (U/L) | <30 The Drive podcast #82 with Robert Lustig | |
| Total bilirubin (mg/dL) | <1.2 | |
| γ-Glutamyl Transferase (GGT) | <20 optimal, <30 recommended; The Drive podcast #82 with Robert Lustig | |
| Kidney | ||
| Cystatin C (mg/L) | <0.95 / 0.5-1 | |
| eGFR Cystatin C (mL/min/1.73m²) | >90 | |
| Creatinine w/ eGFR (mg/dL) | Men 0.6-1.2, woman 0.5-1.1; general medical guideline | |
| Hematological, nutritional, muscle, protein markers | ||
| Hb (g/dL) | 13.5 - 17.5 | |
| Ferritin (µg/L) | Men and post-metapausal 30 - 200, pre-metapausal 30-100 The Drive podcast #82 with Robert Lustig | |
| Hematocrit | 41-50% (men) / 36-44% (women) | |
| MCH (pg/cell) | 27-33 | |
| Iron+TIBC | 250-450 ug/dL | |
| Iron | 15-55 | |
| Creatine | 0.17-0.55 mg/dL | |
| Total Protein | 6-8.4g/dL | |
| Vitamin D (ng\ml) | 40 to 60 The Drive podcast #47 with Bill Harris | |
| Vitamin B12 and Folate | 600-1000 pg/mL Folate >5.8 | |
| Copper serum | 69-132 | |
| Magnesium (RBC) | 4.8-6.8mg/dL | |
| Non-laboratory | ||
| Colonoscopy | ||
| Waist Size | = Half your height | |
| Sauna Usage Time/Temp | ||
| Dexa scan | ||
| CAC |
I agree with you that insulin is hugely important. I have read that insulin release is pulsatile, so the measurement may be capturing a value that differs from the typical. But if you have more than one measurement of insulin and the measurements are consistent, that is very reassuring.
I am surprised that your insulin level can be low while your avg. blood sugar is relatively high. Is it possible that post-prandially your glucose is quite elevated, but it is low when you are fasting? I don’t know.
Another possibility is that A1c is not the best measurement for you. I think the concept is the red blood cells have about a 90 day half life, so A1c is kind of measuring what happened on average over the preceding 90 days. But I read that some people’s blood cells may turn over more slowly - say, 110 days. And if so, we’d expect them to be more glycated given an equivalent amount of blood sugar, since they had a longer exposure. Maybe you are in that category? I don’t know.
I don’t know anything about PI3K signaling pathways, ERK MAPK pathways, or the AP-1 family of bZIP transcription factors. Your knowledge is much deeper and more extensive than mine. I have no comment on these things - you are operating way beyond my ability to engage.
Best wishes and good luck!
So you are not insulin resistant as your HOMA-IR is <2.0.
There are multiple factors as to why you’d be running at 5.7%. Essentially your pancreatic setpoint for releasing insulin may be a little off in that your body is happy watching your blood sugar go up, higher than most individuals before responding.
You can always do a glucose tolerance paired with insulin and glucose levels sequentially for 5-7 specimens and map things out and meet with an expert to interpret.
Generally - I find berberine or metformin seems to help in most individuals in this situation - but talk with your doctor.
Additionally, if you have any weight to lose or hypothyroidism or hypogonadism that can influence these numbers - although generally it is through being more insulin resistant, which you are not.
My reasoning was that in the fasted state my blood sugar stabilizes, and then doesn’t require much insulin to deal with (i.e not insulin resistant). But I’m in a ‘bulking’ phase, and am consuming a lot of food every day, which I’m guessing does slightly elevate my average blood sugar level/A1C.
I wasn’t aware that GTTs were that readily available, I’ll have to look into getting one.
Another possibility is that A1c is not the best measurement for you. I think the concept is the red blood cells have about a 90 day half life, so A1c is kind of measuring what happened on average over the preceding 90 days. But I read that some people’s blood cells may turn over more slowly - say, 110 days. And if so, we’d expect them to be more glycated given an equivalent amount of blood sugar, since they had a longer exposure.
That’s another possibility. According to ChatGPT, RBC half-life can be measured with Cr-51 labeling, although I imagine that test is more difficult to obtain.
I am a great fan of looking at the CGM outputs. Peak is an issue because of the effect on mtDNA
@John_Hemming I’m curious. Do you have any idea if blood glucose at 180mg/dl causes twice as much glycation as 90mg/dl in the same period of time, or is 180 10x as much glycation on red blood cells?
And what about mitochondria damage? Is twice the blood sugar twice the damage or worse?
I’m posting a contrarian view to stimulate discussion and perhaps new information, not because I’m convinced of its merit.
The research I have read suggests that cellular damage from long term elevation of blood glucose occurs at levels higher than we see in a normal cycle of pre-diabetics or even some early phase diabetics who have normal insulin sensitivity but reduced insulin output due to (to simplify for this discussion) “fatigued or inflamed” beta cells. Part of my questioning goes back to a point I mentioned before of knowing people who lived in good health well into their 90s with BG levels that were elevated for the last 50-60 years of their lives. I might possibly fit this category. Even though my A1C is borderline and my fasting AM BG is typically 100-110, I have measured after heavy meals with plenty of carbs and haven’t seen a reading above 150. I wonder if we would come to different conclusions about how to treat the condition if we were to examine all cause mortality by mean area under the curve above a threshold of 180 or 200 mg/dl.
This is really valuable. Thank you for your efforts at compiling and sharing this!
You can look at what diabetes damages and possibly extrapolate that to the glucose spikes or elevated glucose. Peter Attia have done this comparison before but I don’t know how true it is.
But… here is what I find that seems to contradict this. Acarbose and Canagliflozin both are agents for lowering blood sugar levels and even in healthy non-diabetic mice, extended lifespans very significantly (9% to 17%). This seems to argue for blood glucose damage happens at much lower levels than in diabetics, don’t you think?
On the other hand acarbose and SGLT2i barely lower glucose levels in non diabetic humans.
The role of acarbose is to blunt the glucose spikes from the carbs intake which it does very effectively.
Here is a little experiment I did. I ate around 13:00 a rather low carbs meal with some homemade sourdough bread, an honeycrisp apple and 100mg acarbose => no glucose spike
Then I ate a similar meal around 18:00 without acarbose => +37mg/dl spike. Very short BTW which is good as it shows good insulin sensitivity.
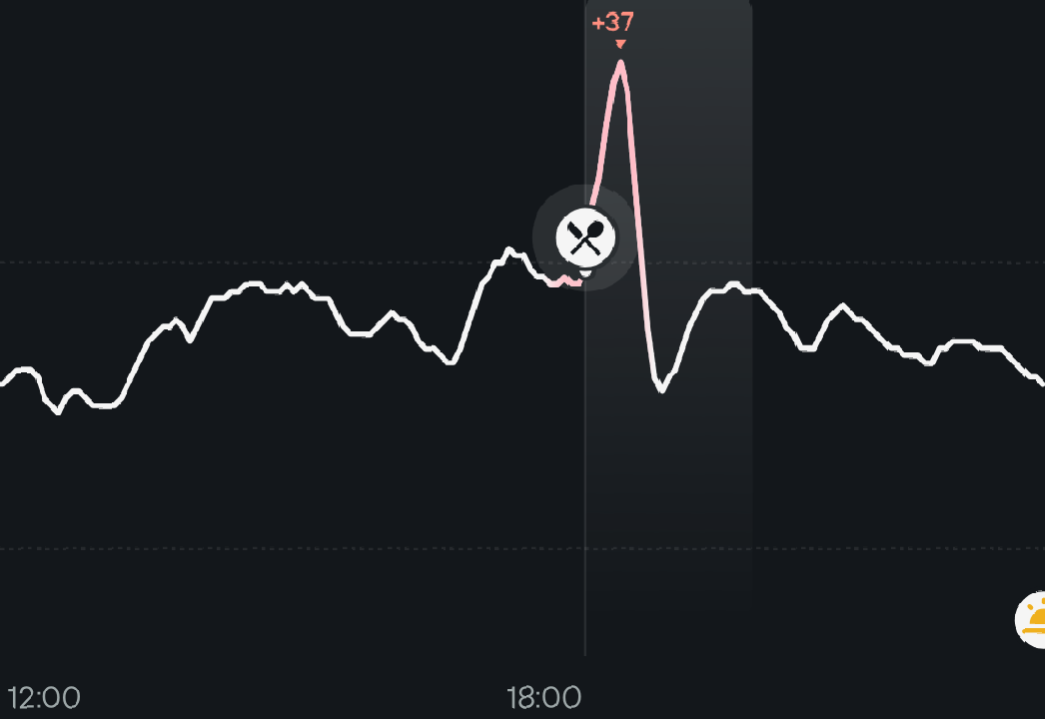
Clearly the area under the curve of that spike is not much and it’s even compensated by a dip in glucose after it so, in the end, the AUC change is minimal if any.
This is an interesting and maybe still partially unresolved question. Based on the evidence, it would seem that all reductions in BG (to some point where the curve goes the other direction) are beneficial. I wonder if some other factors are in play as well. For example, I feel “not quite right” when my BG drops into the 80’s, which is often held as a target. I feel great when it is in the 90’s or even in the very low 100’s. The negative feelings in the 70’s could be some kind of conditioned response that might change if I maintained it at that level or it could be due to hard wired individual differences. For me, steel cut oatmeal almost always causes my BG to drop into the 80’s a few hours after eating it.
How reliable are these sources. The one above is not real for example. Episode #112 was with Ned David I think and as far as I remember Peter has never had Brad Stanfield on his podcast.
Similar there are refs to a Drive podcast with Robert Lustig - but it does not seem like Peter has ever had him on the podcast either?
AI generated so … not reliable.