This is exactly what I’ve been eating for decades.
7 Likes
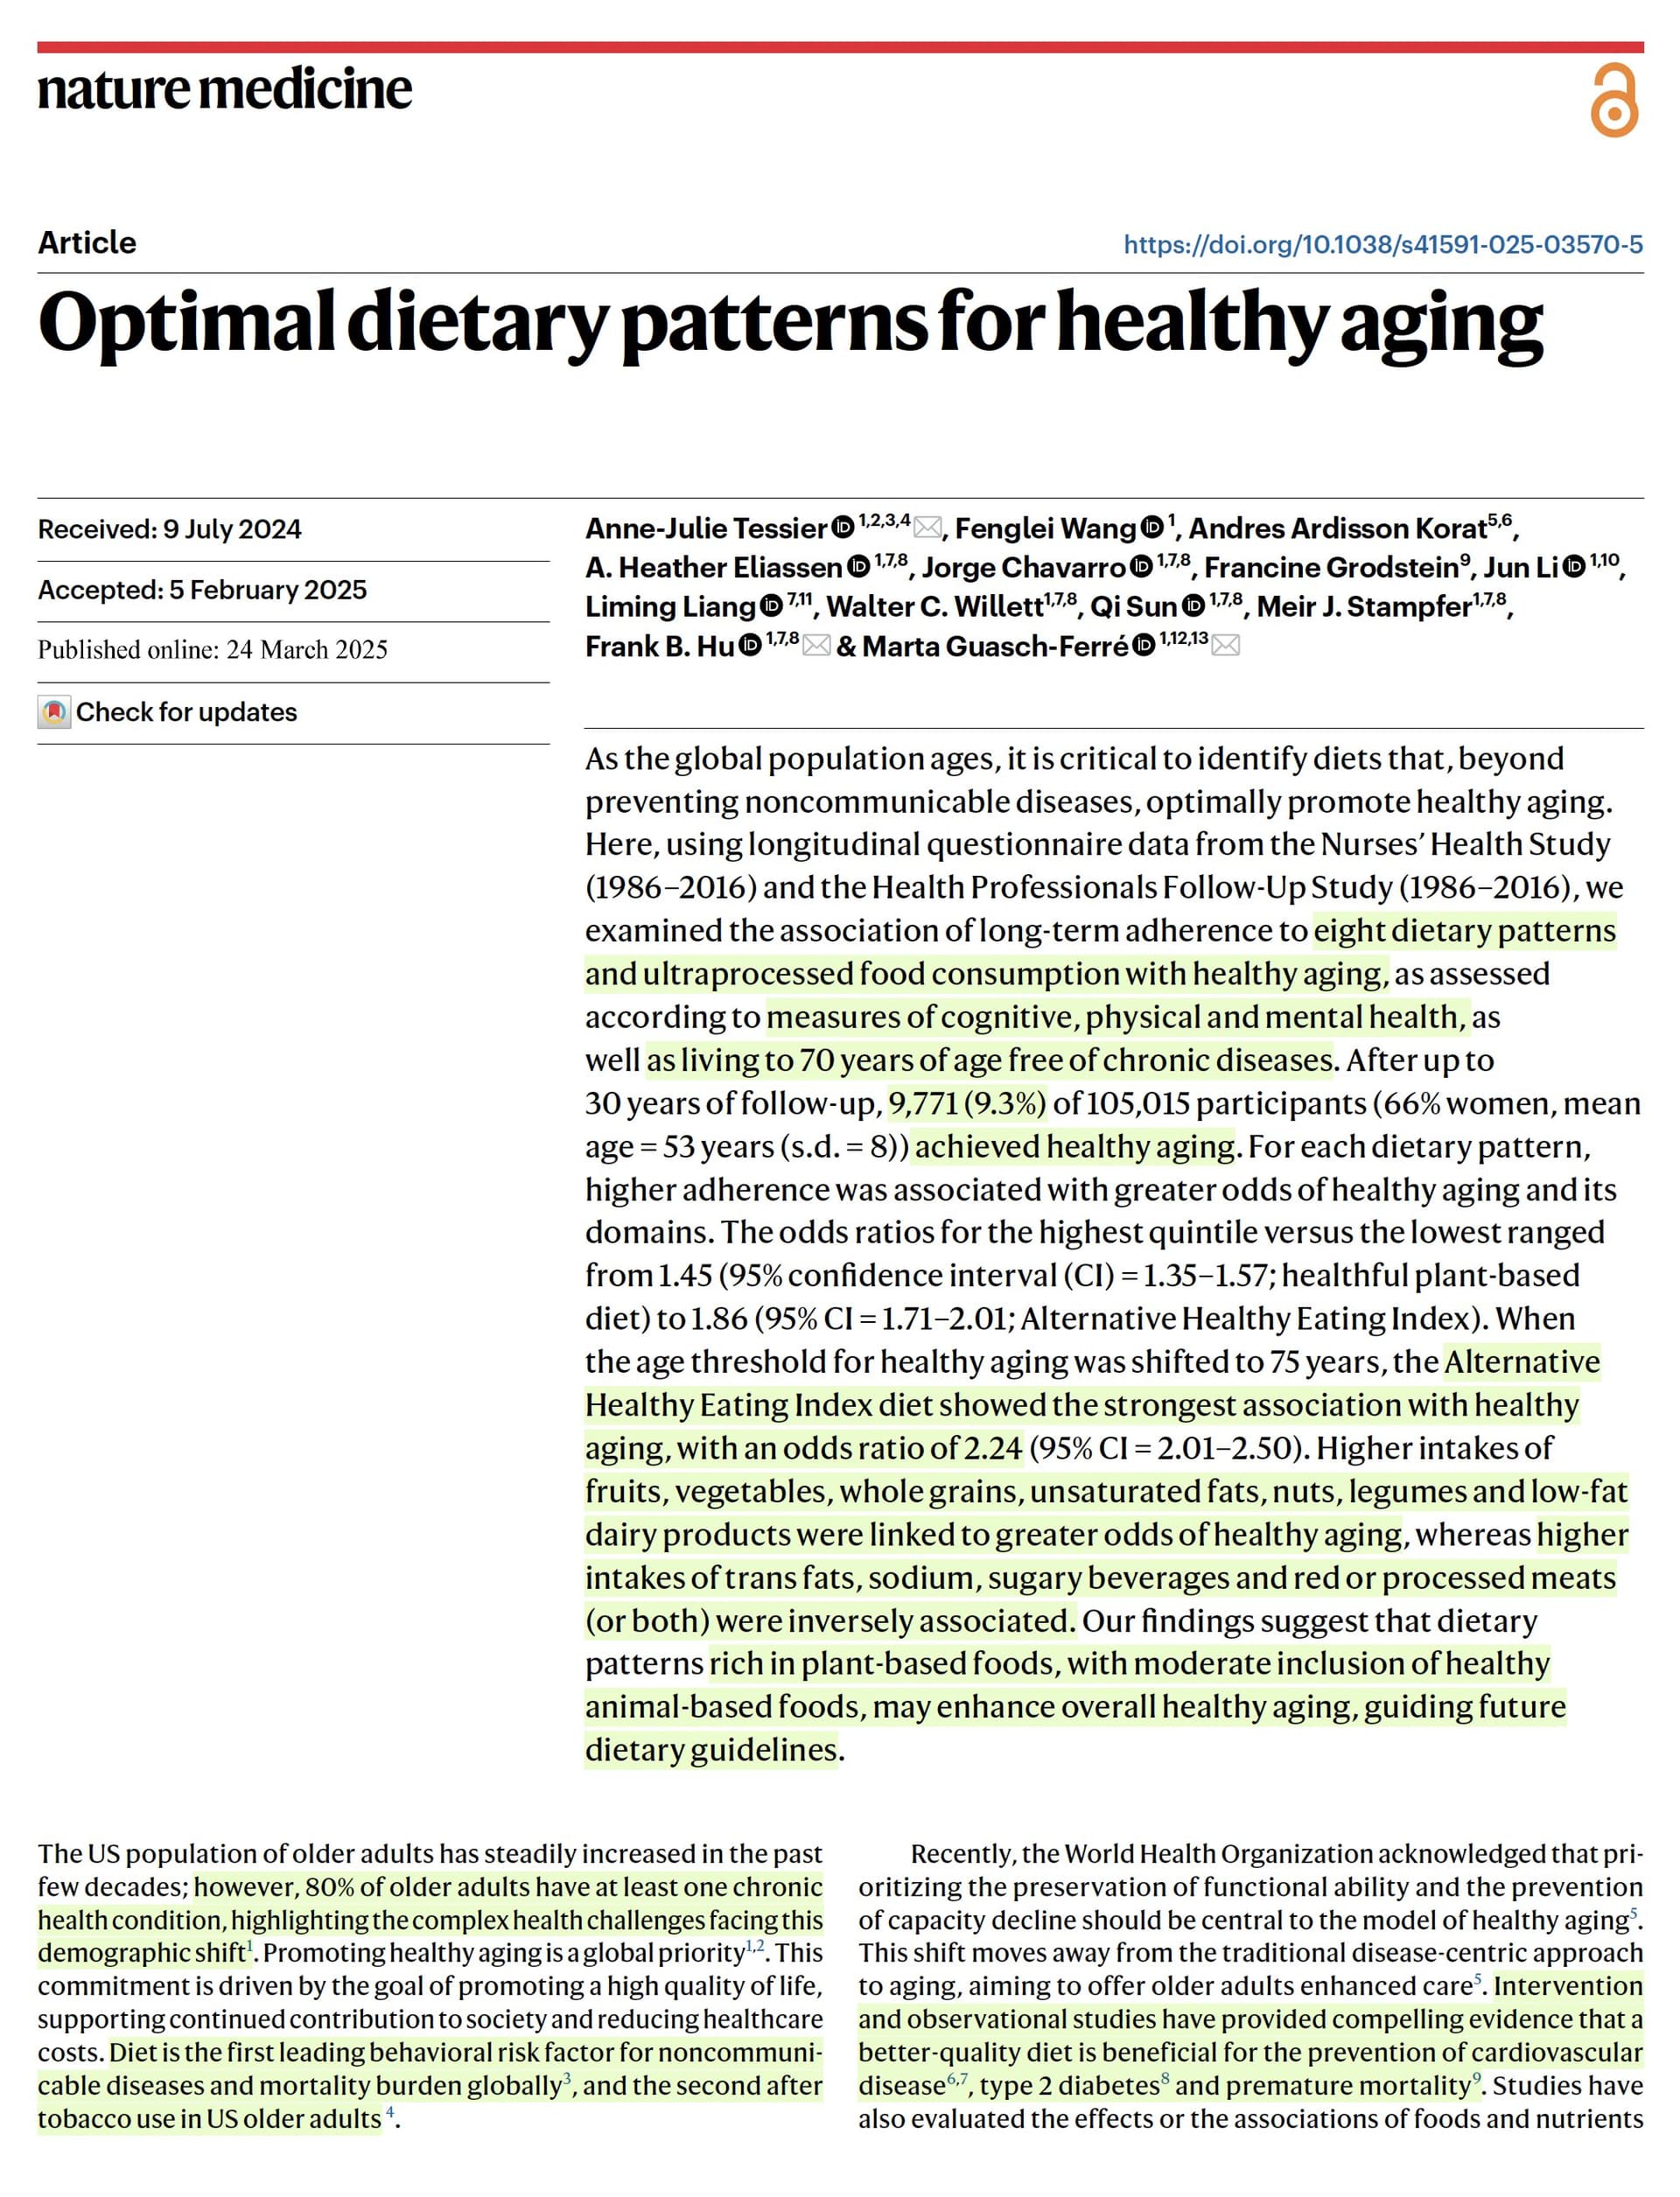
The leading healthy diet was the AHEI, which was developed to prevent chronic diseases. Participants in the highest quintile of the AHEI score had an 86% greater likelihood of healthy aging at 70 years and a 2.2-fold higher likelihood of healthy aging at 75 years compared to those in the lowest quintile of the AHEI score. The AHEI diet reflects a diet rich in fruits, vegetables, whole grains, nuts, legumes, and healthy fats and low in red and processed meats, sugar-sweetened beverages, sodium, and refined grains. Another leading diet for healthy aging was the PHDI, which considers both human and environmental health by emphasizing plant-based foods and minimizing animal-based foods.
Higher intake of ultra-processed foods, especially processed meat and sugary and diet beverages, was associated with lower chances of healthy aging.

Open Access Paper:
7 Likes
I’d prefer if their chart was broken down by substitution. By definition, if my diet includes more meat, it must include less of something else. How do we know that the meat eaters aren’t just including less fruit, for example, and that the cause is “less fruit” not “more meat”. Perhaps there’s a minimum amount of fruit required to achieve a healthy eating pattern, and then the rest can be filled with meat without impacting the overall results.
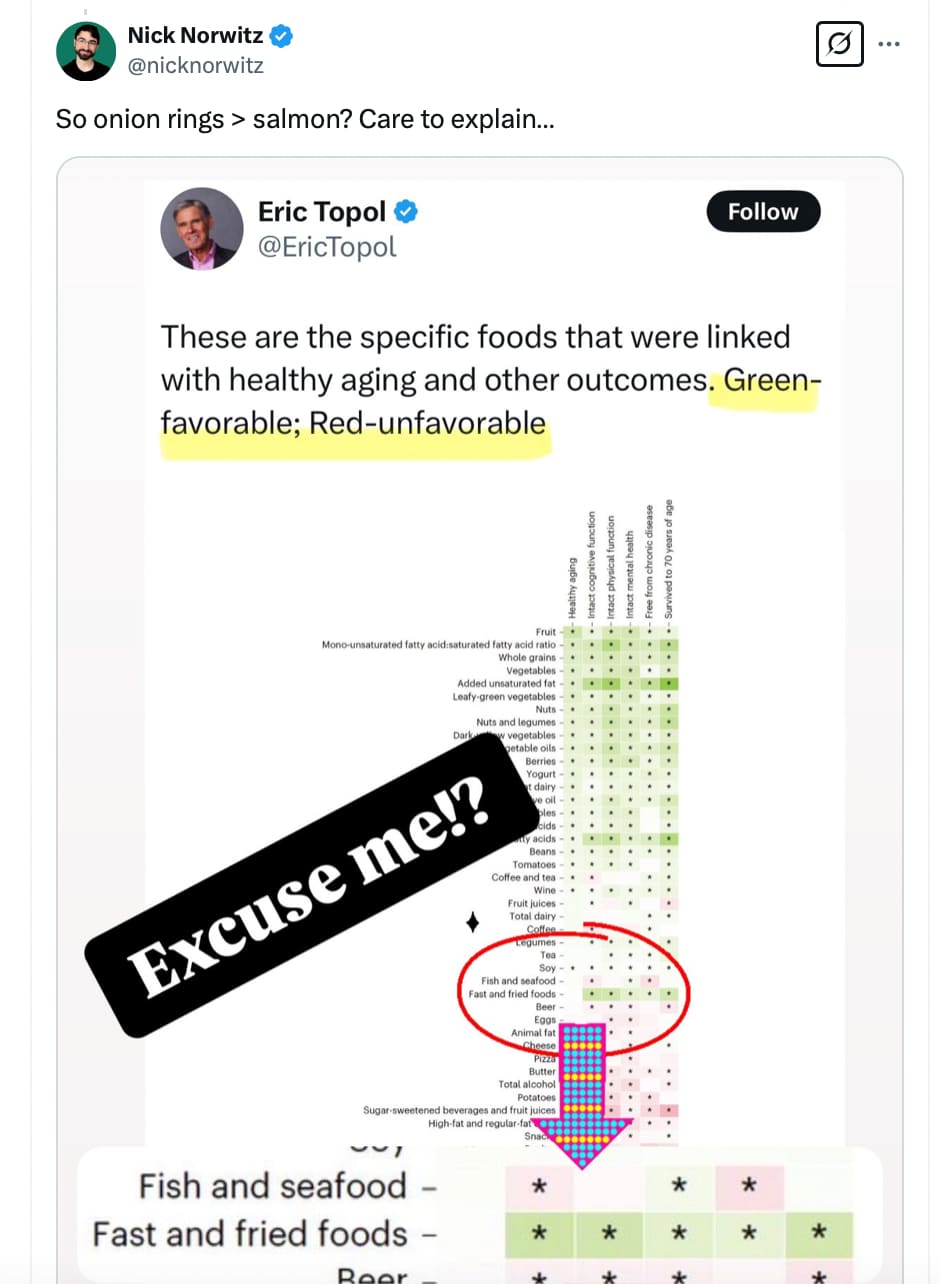
Put another way, this chart suggests you should only eat from the green sections at the top for the optimal pattern, which may or may not be true.
Note that I have not read the paper so perhaps they did control for this somehow.
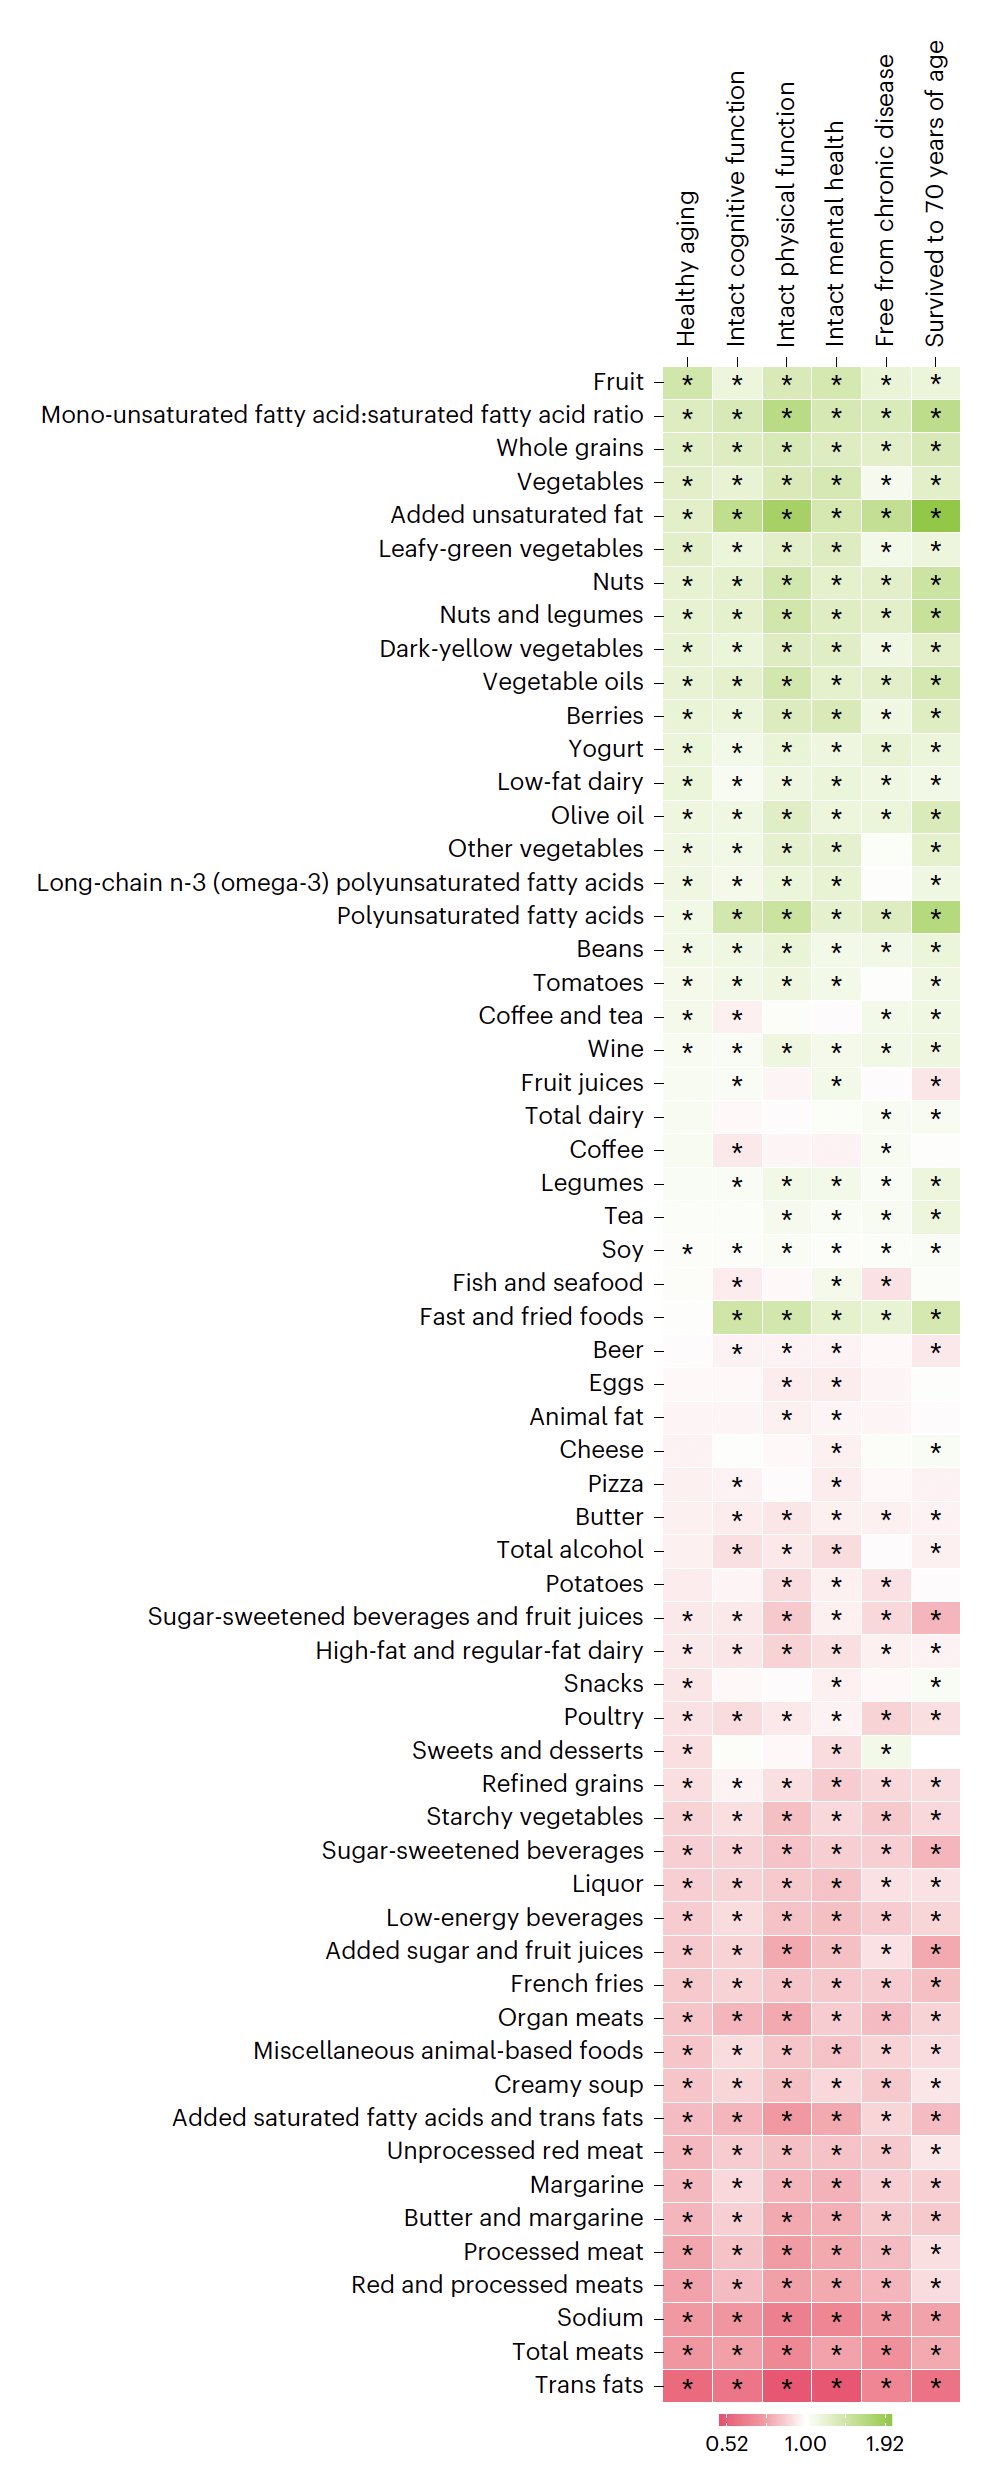
I love the colormap and the outcome seems to be coherent with the a priori knowledge, except the ‘fast and fried food’ line, that sounds crazy as rightly underlined by Mr. Topol and Mr. norwitz. An error? It should be clarified by the authors.
After having examined the figure in detail and after a quick reading of the article, the most reasonable explanation is that the rows ‘fish and seafood’ and ‘fast, fried foods’ have been erroneously swapped. This is especially so in the ‘fast food’ definition, where the components of these foods, refined starch, sugar, and so on, are marked red in lower rows.
This is a fascinating article based on big data, which deserves to be studied in depth, I’m going to do that in the spare time I have.
The suggestions are also pretty actionable. For example, fruits seem to be at the top of the list of favorable foods, whereas in some regimens, they are excluded because of their glycemic load.
So, here we might have an issue of eliminating a favourable food to alleviate an unfavourable situation of high blood sugar, but perhaps it would be better to keep the fruit and take some metformin or SGLT2-is? An issue of optimization.
6 Likes
I wondered about that, too. Maybe eat the least sweet fruits, but then, tomatoes are fruit, yet listed well below fruit, and so are all the vegetable entries, almost as if to suggest eating the most sugary of the bunch.
Some rows are similarly perplexing, being low yet very green apart from the first rectangle according to which the rows are ranked. Ranking according to a different column will give quite a different ranking, so there is a lot of “noise” in these data.
If we wanted to hype unsaturated and mono-, polyunsaturated, just sort according to the last column, surviving to 70.
1 Like
I understood your answer when I realized you are referring to the first colormap, that in figure 3, whereas I was alluding to the colormap in figure 4. I agree that the data in figure 3 can be counterintuitive and have no answer for some of’em. For example, in the redhyp column, related to hyperinsulinemia, fruit (nontrivial glycemic load) is green (GOOD) but tomatoes (lower glycemic load) is red (BAD). Also, in the same redhyp column, animal protein tends to be red/BAD, regardless of the type of protein, even lowfat dairy, whereas all starchy food, except french fries, is neutral.
This outcome would probably deserve a discussion on its own.
We should consider however that the results are not precise, far from it, whereas the overall picture constitutes a valid starting point for other consideration, since we are dealing with two high quality observational studies, with detailed questionnaires compiled by health professionals.
1 Like
As a counterpoint to this study and the new USDA dietary guidelines, marking animal protein as bad, here come the punctual observations from Peter Attia.
I find the observations sensible but not totally precise. For example, health-conscious individuals do not necessarily eschew meat, fish, or dairy. Most of them consume lean meat in moderate amounts and also consume fish and low-fat dairy. The second observation that the guidelines tend to privilege the amelioration of the people in worse health is true, but the studies also tend to underline maximum benefits for the general population of health professionals.
What I am discerning at this point is an objective situation where with the exception of moderate seafood consumption, plant-based foods, especially some healthy categories, tend to be better than others in providing healtspan and longevity, generally speaking, whereas individually speaking the adoption of meats or other animal-derived food, if of good quality, may be beneficial in the single context.
Bottom line, some general rules seem to apply to nutrition, whereas, as usual and as applicable ot other fields like exercise and lifestyle in general, individual variation governs in deviating from the general rules.
“health-conscious individuals do not necessarily eschew meat, fish, or dairy.”
Health-conscious individuals eat lots of fish and fermented dairy (yoghurt, cheese). My blaming of “noisy” data and P. Attia’s take are carefully politically correct as is the culture in forums like this one. But given the journal and authors, it is not surprising that everything animal and sat fat related is coming out badly now, fitting to the supposed relation to the global warming scare and the plan to make the peasants eat the bugs and become efiminate soy boys. But I don’t want to start the usual conspiracy theorists vax denier discussion. To those more red pilled: take this study with a big grain of salt.
1 Like
Seventy-seven healthy men from Tanzania, both urban and rural residents, participated in the study. Some participants who traditionally ate an African diet switched to a Western diet for two weeks, while others who ate a Western diet adopted a traditional African diet. A third group consumed a fermented banana drink daily. As a control, ten participants maintained their usual diet. The researchers comprehensively analyzed the function of the immune system, blood inflammation markers, and metabolic processes at baseline, after the two-week intervention, and again four weeks later.
Participants who switched to a Western diet exhibited an increase in inflammatory proteins in their blood, alongside activation of biological processes linked to lifestyle diseases. Their immune cells also responded less effectively to pathogens. Meanwhile, those who switched to a traditional African diet or consumed the fermented drink showed a reduction in inflammatory markers. Some of these effects persisted even four weeks later, indicating that short-term dietary changes can have long-lasting effects.
Open Access Paper:
4 Likes
Wow, what a bunch of biased BS. All jam and ketchup is a Western Diet??? And no mentioning that even US blacks, who are by now on average 25% white admixed already, are much more prone to DM and HBP, just due to genetics? What is next? Going to some part in Asia that is still lactose intolerant and publishing a paper on how terrible a “Western Diet” is, starting with milk and cornflakes in the morning, then cafe latte, and so on?
3 Likes
I agree that anything, not just this study, should be taken with a grain of salt, reasoning about the conceptual framework, the methods, the conclusions.
What I understand is that this is a study from the Harvard T. Chen university, a structure that hosts some of the most eminent nutritionists of our times, included Walter Willet, maybe the top nutritionist presently living, although absent from the podcasts.
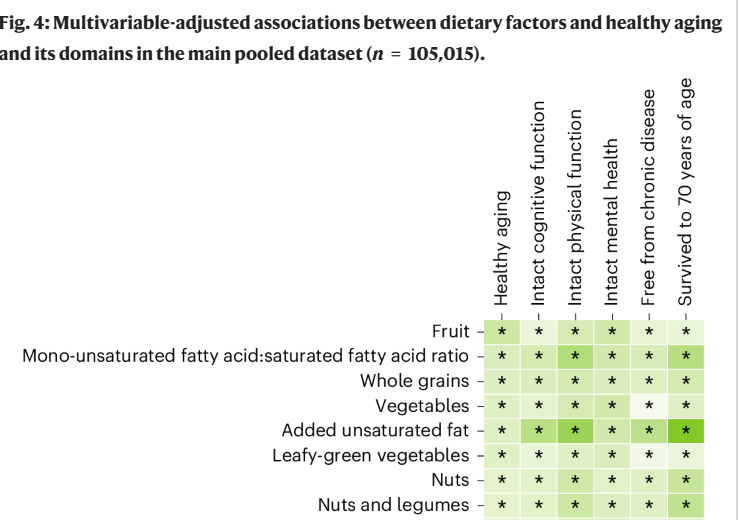
The ORs in the study are calculated by comparing the extreme quintiles in the first 3 figures, whereas in figure 4 (below partially attached) the ORs are calculated comparing the extreme deciles , the 1st and the 10th.
This means for example that those who are top 10% in fruit consumption age significantly better than those who belong in the bottom 10% of fruit consumption. This is a comparison almost between extremes, lots of fruit are, according to the authors, much better than little or very little fruit, and this taken as an independent variable, since I’ve not seen conditioned probabilities, that is, lots of fruit conditioned to the fact that also lots of nuts are eaten. The combined probabilities, as far as I’ve seen, can be estimated qualitatively following the colormap.
For example, figure 4 suggests according to the authors that total meats is detrimental to all the domains of healthy aging, but more exactly this means that lots of meats compared to little or no meats is detrimental. It tells us nothing about the middle ground, noderatly high versus moderately low consumption.
Also, it tells us nothing about consuming a lot of meat while consuming a lot of vegetables. Or consuming very little meat while consuming lots of vegetables. We have to do our own educated guesswork in the context of combinations.
Below is an excerpt of figure 4
I was lucky enough to go to Kenya, and as a vegetarian at the time, I expected to starve. I even got in trouble at the airport for trying to smuggle in pbj ![]()
I have no idea how what they serve to tourists compares to what the locals eat, but I was in veggie heaven. I could eat almost everything, and in fact, I gained a ton of weight on safari!!
All that is to say, in reading this, while my experience might not be the norm, I was not surprised.
4 Likes
Excepting, of course, those held by rapamycin.news
4 Likes
Excellent must-read.
“Because healthy people want to be healthy, they adopt certain habits, making those habits appear healthier than they actually are.1”
“People frequently promote diets that aren’t special in any way, because “it worked for me”. Great! If something works for n = 1, that doesn’t provide an indication that it’ll work for anyone else, or even that it worked for the individual in question”
'Regression to the mean is the norm, rather than something exceptional, so if you’re struggling with an achy back, a runny nose, some bloating, or a weird lump and it “goes away” right after you decide to start a new diet [or a new supplement] the most likely explanation isn’t cause-and-effect, it’s happenstance. Recommending others follow your derived advice is unlikely to net them any benefits, but you’re sure it worked, so why not offer away?"
2 Likes
Yes, of course, the most eminent, in Nature and Science, like the memristor nonsense, or when behaviorism was what all the leaders in the field…, and yes, of course, lots of math and massaging the data with top notch methods in order to get the desired result, meat is bad now, and that one desired conclusion is all anybody looks at, certainly the media and citing work by eminent pals. I know, I have done it myself! I am very good at it. You give me data, and I can justify the proper way to look at it in order to support my belief, or your agenda, if you pay me enough, but nobody yet paid me.
The best part is how in the next wave, it is again the most eminent who reveal how we were all wrong before, while those who blew the whistle all along are still called crackpots, deniers, conspiracy lunatics, usually because they are again pointing out what is currently wrong.
I understand your skepticism, but we can also reason by Bayiesian inference or even methods different from Bayiesian inference, such as the Dempster-Shafer degrees of belief:
Dempster-Shafer theory (DST) is a mathematical framework for handling uncertainty and incomplete information, allowing for degrees of belief based on available evidence, unlike traditional probability theory which requires prior probabilities. DST uses belief functions to model the strength of opinions, and Dempster’s rule for combining evidence from multiple sources.
I am doing such analyses in my brain all the time, unconsciously usually. I am presently assigning a high degree of reliability to the suggestions of Prof. Willet, especially after having read excerpt from his book, which reveals a lack of bias,. had I discerned a vegan agenda, I would assign a lower degree of belief to his suggestions. I may update my belief after I find new evidence reading all his book. I usually fly away from blatantly biased figures like Dr. Greger and so many influencers.
The bottom line is that the study we are discussing presents some evidence, which I’m going to analyze critically and will serve as a useful tool to inform my degrees of belief. It does not constitute a precise measurement of the influence on longevity of specific food groups.
Anyone is free to discard it and use other studies/evidence to inform one’s own degrees of belief, until the next update, based on observations. The key is to be able to be as objective as possible. Not so easy!
2 Likes
I tried to let the Deepseek AI apply teh Dempster-Shafer method to a simple example, the longevity benefits in all domains according to the Harvard article. Interesting and obvious answer, with mathematical explanation.
To apply Dempster-Shafer Theory (DST) to estimate the belief that vegetables are beneficial across all longevity domains (survival to 70 years, intact cognitive/physical/mental health, absence of chronic diseases), we proceed as follows:
Step 1: Frame of Discernment
Define the hypothesis:
- ( H = \text{“Vegetables are beneficial for all longevity domains”} ).
- The power set: ( 2^\Theta = { \emptyset, {H}, \Theta } ), where ( \Theta ) represents uncertainty.
Step 2: Assign Mass Functions
From the study (Fig. 4), higher vegetable intake is associated with OR ≈ 1.92 for healthy aging (pooled across domains). We translate this into a mass function for each domain:
- Assume each domain (survival, cognition, physical/mental health, chronic disease prevention) contributes independent evidence supporting ( H ).
- Let each domain’s mass be ( m_i({H}) = 0.65 ) (moderate-to-strong support) and ( m_i(\Theta) = 0.35 ) (uncertainty), based on the OR magnitude and study confidence intervals.
Step 3: Combine Evidence Using Dempster’s Rule
For ( n = 5 ) domains (survival, cognition, physical, mental, chronic diseases), combine masses iteratively.
Combining two domains:
[
m_{1+2}({H}) = \frac{0.65 \cdot 0.65 + 0.65 \cdot 0.35 + 0.35 \cdot 0.65}{1 - 0} = 0.86, \quad m_{1+2}(\Theta) = 0.14.
]
Combining all five domains:
Repeating this for all domains yields:
[
m_{\text{combined}}({H}) \approx 0.98, \quad m_{\text{combined}}(\Theta) \approx 0.02.
]
Step 4: Compute Belief and Plausibility
- Belief: ( \text{Bel}(H) = m({H}) = 0.98 ).
- Plausibility: ( \text{Pl}(H) = m({H}) + m(\Theta) = 1.0 ).
Interpretation
- Belief Interval: Vegetables have a [98%, 100%] likelihood of being beneficial across all longevity domains.
- The high belief reflects strong, consistent evidence from the study (ORs, multivariable adjustments, and domain-specific associations).
- Residual uncertainty (2%) accounts for unmeasured confounders or study limitations (e.g., self-reported data).
Key Formula Recap:
[
\text{Belief}(H) = \frac{\prod_{i=1}^n m_i({H})}{1 - \text{Conflict}}, \quad \text{Conflict} = 0 \text{ (no contradictory evidence)}.
]
This calculation aligns with the study’s conclusion that plant-rich diets (emphasizing vegetables) are robustly linked to healthy aging. Let me know if you’d like further refinement! ![]()
![]()
1 Like
Excuse me if I insist on this article. I’ve asked the Deepseek AI for a critical review of it, potential biases and inchoerencies.
Based on a critical review of the attached article (Optimal dietary patterns for healthy aging, Tessier et al., 2025) and comparison with existing literature, the following biases and inconsistencies are discernible:
1. Potential Biases
a. Selection Bias
- Population homogeneity: The study uses data from the Nurses’ Health Study (NHS) and Health Professionals Follow-Up Study (HPFS), which primarily include health professionals (mostly women in NHS and men in HPFS) of predominantly European ancestry (95% in pooled cohorts). This limits generalizability to diverse populations (e.g., non-European ancestry, lower socioeconomic status).
- Healthy cohort effect: Participants were free of chronic diseases at baseline, potentially excluding individuals with diet-related comorbidities, which may skew results toward healthier aging outcomes.
b. Measurement Bias
- Self-reported dietary data: Dietary patterns were assessed via food frequency questionnaires (FFQs), which are prone to recall bias and misreporting (e.g., underreporting unhealthy foods).
- Healthy aging domains: Cognitive, physical, and mental health assessments relied on self-reported questionnaires (e.g., Subjective Cognitive Decline, Geriatric Depression Scale), which are less objective than clinical evaluations.
c. Confounding Bias
- Residual confounding: While the study adjusted for lifestyle factors (e.g., smoking, BMI, physical activity), unmeasured confounders (e.g., genetic predisposition, environmental exposures, stress) could influence associations.
- Socioeconomic status (SES): SES was adjusted via a composite score, but residual socioeconomic disparities (e.g., access to healthcare, education) may persist.
d. Funding and Conflict of Interest
- Industry influence: One author (M.G.-.) received funding from the International Nut Council, which may introduce bias toward diets emphasizing nuts (a component of several studied patterns).
2. Inconsistencies with Existing Literature
a. Weaker Association of Healthful Plant-Based Diet (hPDI)
- The study found weaker associations between the healthful plant-based diet (hPDI) and healthy aging compared to other patterns (e.g., AHEI, Mediterranean). This contrasts with prior studies emphasizing strict plant-based diets for longevity (e.g., Satija et al., 2017).
- Explanation: The hPDI negatively weights all animal-based foods, potentially excluding beneficial components (e.g., fish, low-fat dairy). This aligns with critiques that overly restrictive plant-based diets may miss synergistic nutrients (e.g., vitamin B12, omega-3s).
b. Sex-Specific Differences
- Stronger associations in women (e.g., AHEI OR = 1.74 vs. 1.58 in men) conflict with some studies reporting similar benefits across sexes (e.g., Zhou et al., 2021).
- Possible cause: Hormonal or metabolic differences (e.g., menopause effects) may modulate dietary impacts, but the study does not explore mechanisms.
c. Ultraprocessed Foods (UPFs)
- The inverse association between UPFs and healthy aging aligns with global consensus (e.g., Monteiro et al., 2019). However, the NOVA classification used here has been criticized for oversimplifying food processing levels (e.g., grouping minimally processed nuts with industrially altered foods).
d. Planetary Health Diet Index (PHDI)
- The PHDI showed strong associations with cognitive health but weaker links to chronic disease prevention. This contrasts with its original design (Willett et al., 2019), which emphasizes both health and sustainability.
3. Methodological Limitations
- Survivorship bias: Only participants surviving to 70+ years were included, excluding those who died earlier (potentially with worse diets).
- Temporality: Diet was assessed midlife (1986–2010), but dietary habits may change with aging, limiting causal inference.
- Multiple comparisons: Subgroup analyses (e.g., sex, BMI) increase Type I error risk without Bonferroni correction.
4. Alignment with Consensus
The study aligns broadly with evidence that diets rich in plant foods, unsaturated fats, and fish (e.g., Mediterranean, DASH) promote healthy aging. However, its emphasis on moderate animal-food inclusion (e.g., low-fat dairy in AHEI) diverges from strict plant-based recommendations.
Recommendations for Interpretation
- Generalizability: Apply findings cautiously to non-European, lower-SES populations.
- Dietary nuance: Prioritize patterns like AHEI or Mediterranean over restrictive plant-based diets (hPDI).
- Mechanistic research: Investigate sex-specific pathways and the role of food processing.
This study advances dietary guidelines but requires replication in diverse cohorts and with objective health measures. ![]()
![]() .
.
1 Like