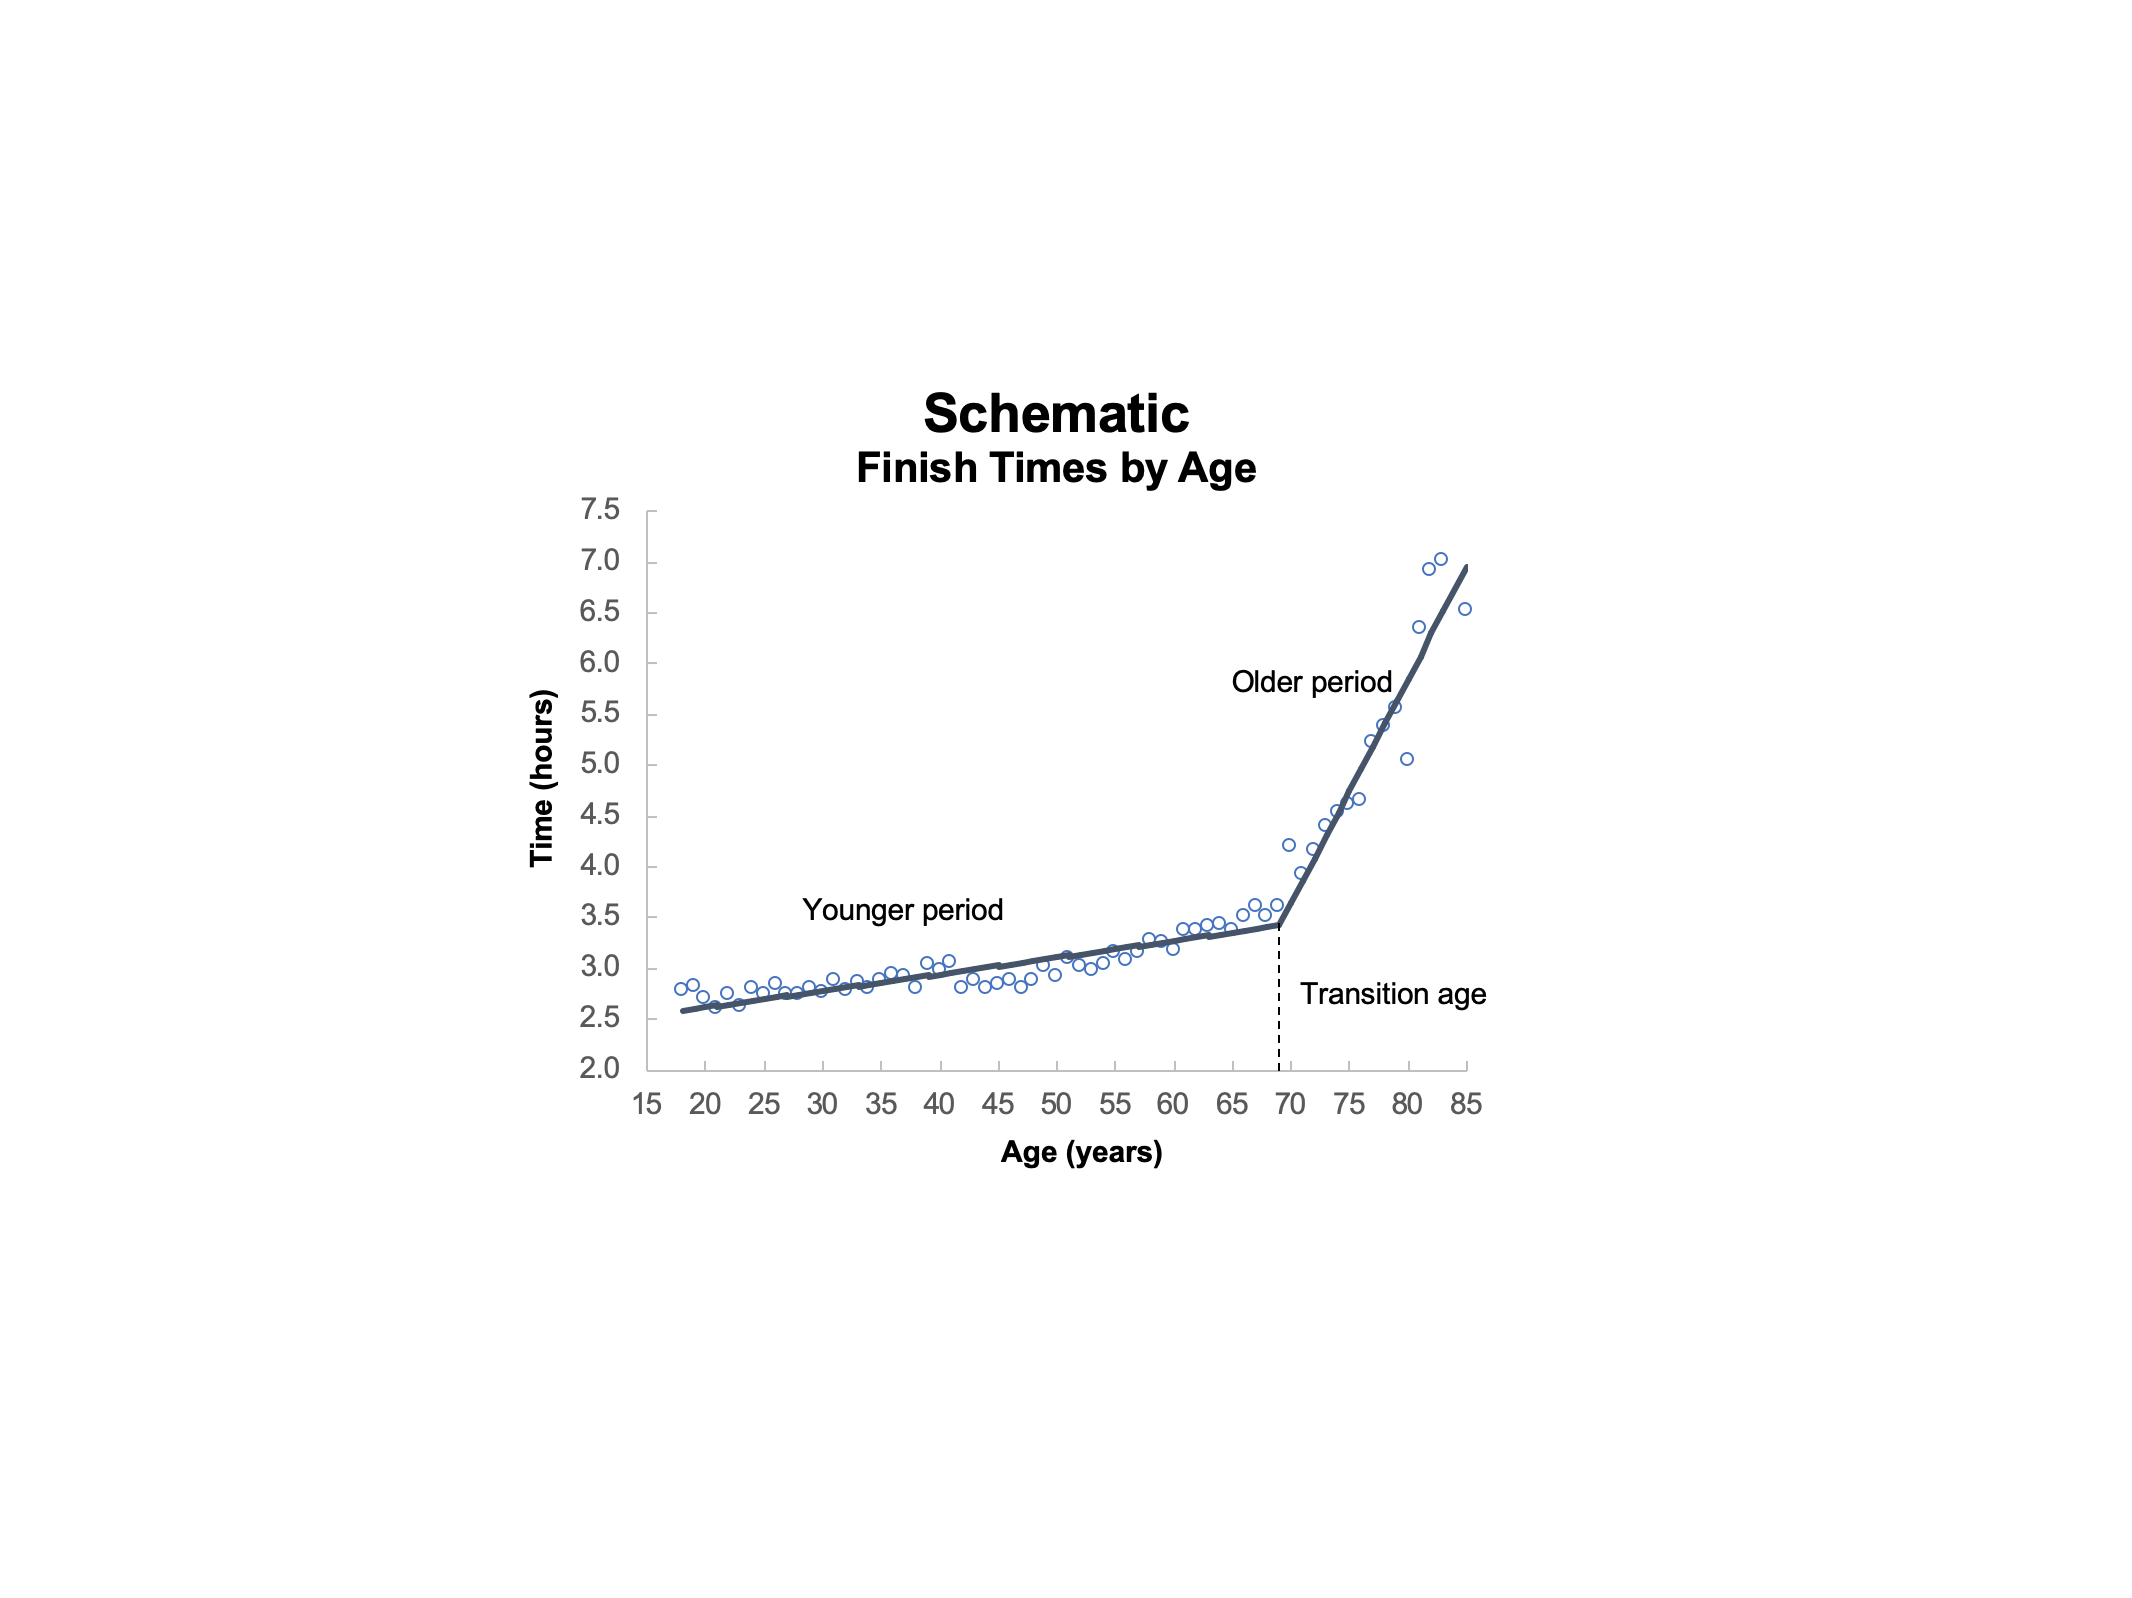
I just stumbled upon this. It’s based on 85000 contestants from the period 1999-2019
Wow - thats a very scary graph.
I would love to see an equivalent exercise study done on mice on rapamycin (if it could be defined) over their lifespan. A battery of functional and exercise tests done on mice who are taking rapamycin (or other potential longevity drugs) compared to control mice doing the same functional and exercise tests not on the longevity drugs.
From what we know about rapamycin (and acarbose, canagliflozin, etc.) we should see a shift to the right for the bend in the curve. The question is how far can you shift it? What is the dose/response?
Perhaps Sublingual rapamycin is the answer… ![]() VO2max: A Significant Increase via Sublingual Rapamycin?
VO2max: A Significant Increase via Sublingual Rapamycin?
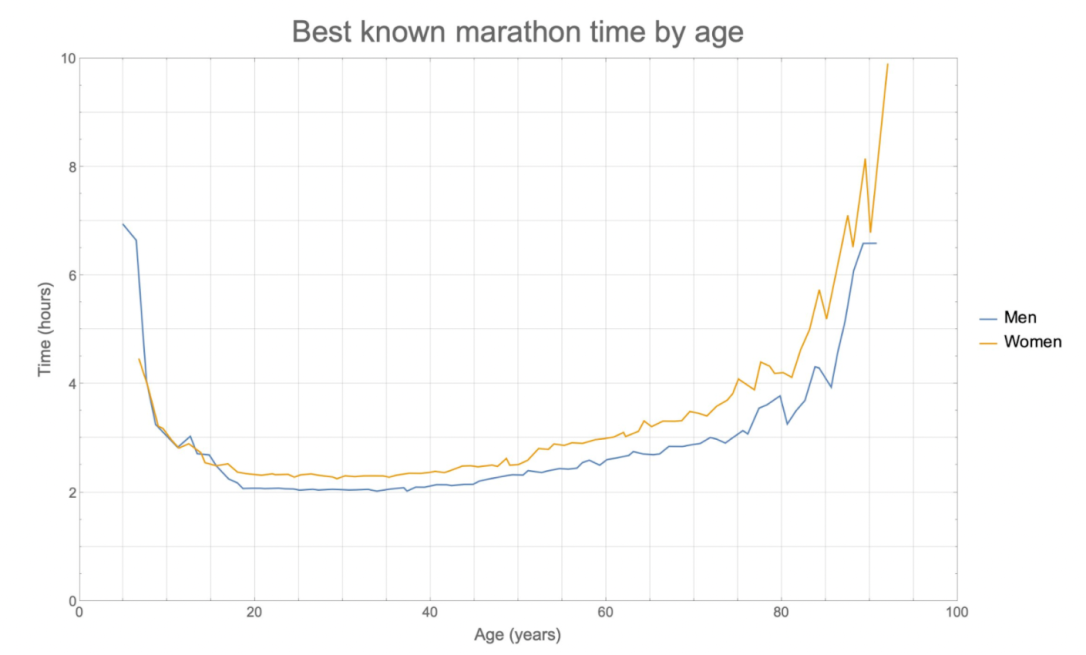
Similar graphs for marathon times… I wonder what sports don’t show this curve?
Source: Marathon Records (by age and gender) - Slow Reveal Graphs
Still, another chart proving it sucks to get old ![]()
Seriously, I personally found that anything aerobic suffered greatly after 60.
I did not notice a drop-off from strength training. People may not believe this, but at 82 I am as strong as I have ever been.
Aww, It thought the slope of the line stayed low until 75. I was counting on 12 more years.

